
Who's Riding That Bike? (Tableau)
Google Data Analytics Certificate Capstone Project in Tableau.
Note: Here is the link to the Tableau workbook I used to explore this data. TABLEAU WORKBOOK LINK You can use it to explore any of the visuals in greater depth.
![]()
What Are We Looking For Anyway?
Cyclistic has over 5,800 bikes and 600 docking stations throughout Chicago with various types of bikes, including assistive options for those with disabilities or who otherwise can’t use traditional two-wheeled bikes. The focus right now is on the traditional types of bikes, which come in three styles: classic, docked, and electic.
We Got A Lot of Bikes: Who’s Using Them?
There are two tiers of Rider Type: Member and Casual. Over the last 12 months (November 2021 through October 2022), Cyclistic has documented over 5.7 million rides. The question being asked is:
How do annual members and casual riders use Cyclistic bikes differently?
To answer this question, I wanted to address a sub-set of questions that will drive Cyclistic’s next marketing campaign to convert casual riders to members.
- How many members are riding monthly compared to casual riders?
- What types of bikes do members prefer use?
- When are these riders using the bikes?
- What are the trip durations like? Average? Median? Max?
- Which Stations are the most commonly used by rider type?
The Data Source
The source of the data comes from Divvy-Tripdata (since Cyclistic is actually made up). The data consists of a Rider ID, Start Date & Time, End Date & Time, Start Station Name & ID, End Station Name & ID, Start & End Latitude & Longitude, Rideable Type, and Member Type. Since each month was its own *.csv file and I wanted to have a single source of the data, I loaded all 12 files into Tableau and performed a union to make the data extra tall. This ended up being 5.7M+ rows of data to explore.
Cleaning and Manipulation
After looking at the data available, I added a column for trip duration, or ride length by doing End Time minus Start Time. When I started looking at the descriptive analytics (min, max, average, median), I noticed there were negative ride times. Further exploration revealed that Daylight Savings Time was one of the culprits of the time travel.
With no way of knowing how many rides were truly affected by the “fall back” in November 2021, I made the best attempt possible. I modified the trip duration calculation to include compensating an hour (plus 1 in November and minus 1 in March 2022) when start time was prior to the Daylight adjustment time and end time was after the adjustment hour. The November adjustment also included any case where the one hour “fall back” would have caused a negative duration. This left some cases where the time change could have shortened the duration by one hour, but didn’t make it go negative (i.e. Start time at 1:06 AM and end time 1:42 AM but could have been 2:42 AM and went back an hour).
Going forward, Cyclistic could avoid this issue by including trip duration as a metric rather than just start and stop time.
The data set still contained a handful for time travelling durations (negative durations). Without knowing how the data is collected, I opted to omit these values from the trip duration calculations. It’s possible that the start and stop times got switched, but without talking to the boss or data collection team, omission seems to be the safest choice since there are less the 20 data points out of 5.7 million.
There was also one data point where the latitude and longitude ended in Canada. Either someone stole a bike out of the city or the lat/long coordinates were recorded incorrectly. Since I didn’t think there was much benefit to look at the lat/long coordinates for membership analysis, I chose to ignore this bit.
Down to the Nitty Gritty
Analysis and Visuals
Let’s take a look at what I found here.
- Total number of rides between Nov 21-Oct 22: 5,755,694
- Total number of Casual Riders: 2,353,033 (40.8%)
- Total number of Member Riders: 3,402,661 (59.1%)
Overall, there were more rides by Members than Casual. That’s a good start. This is the case for every month.
How Many People Are Riding Our Bikes Each Month?
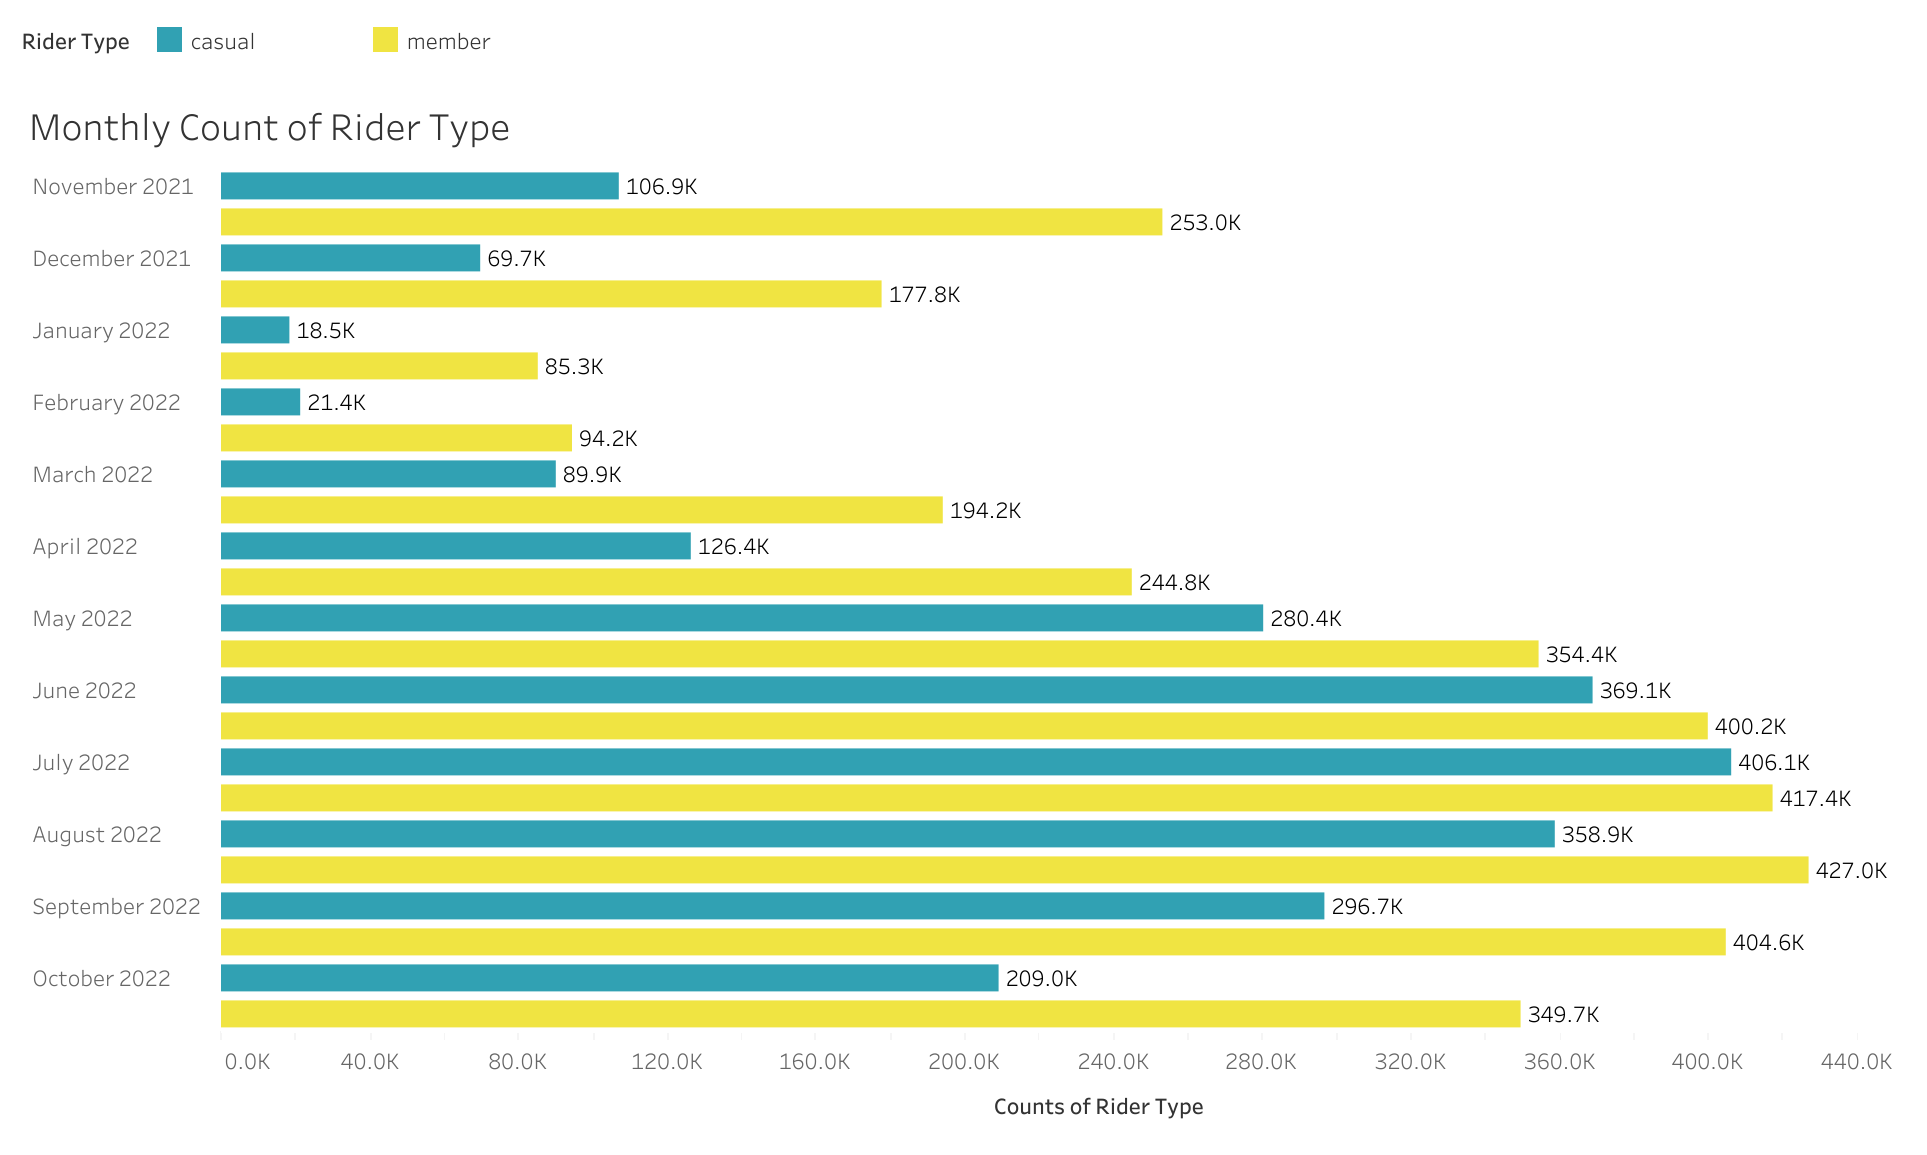
From this Monthly Count By Rider Type bar chart, not only do you see that member rides beat out casual rides every month, but also that casual riders are more “fair weather” riders. They ride a lot more in the warmer months than in the colder months, especially compared to member riders. Take note of that, because that could mean an opportunity to offer short term memberships.
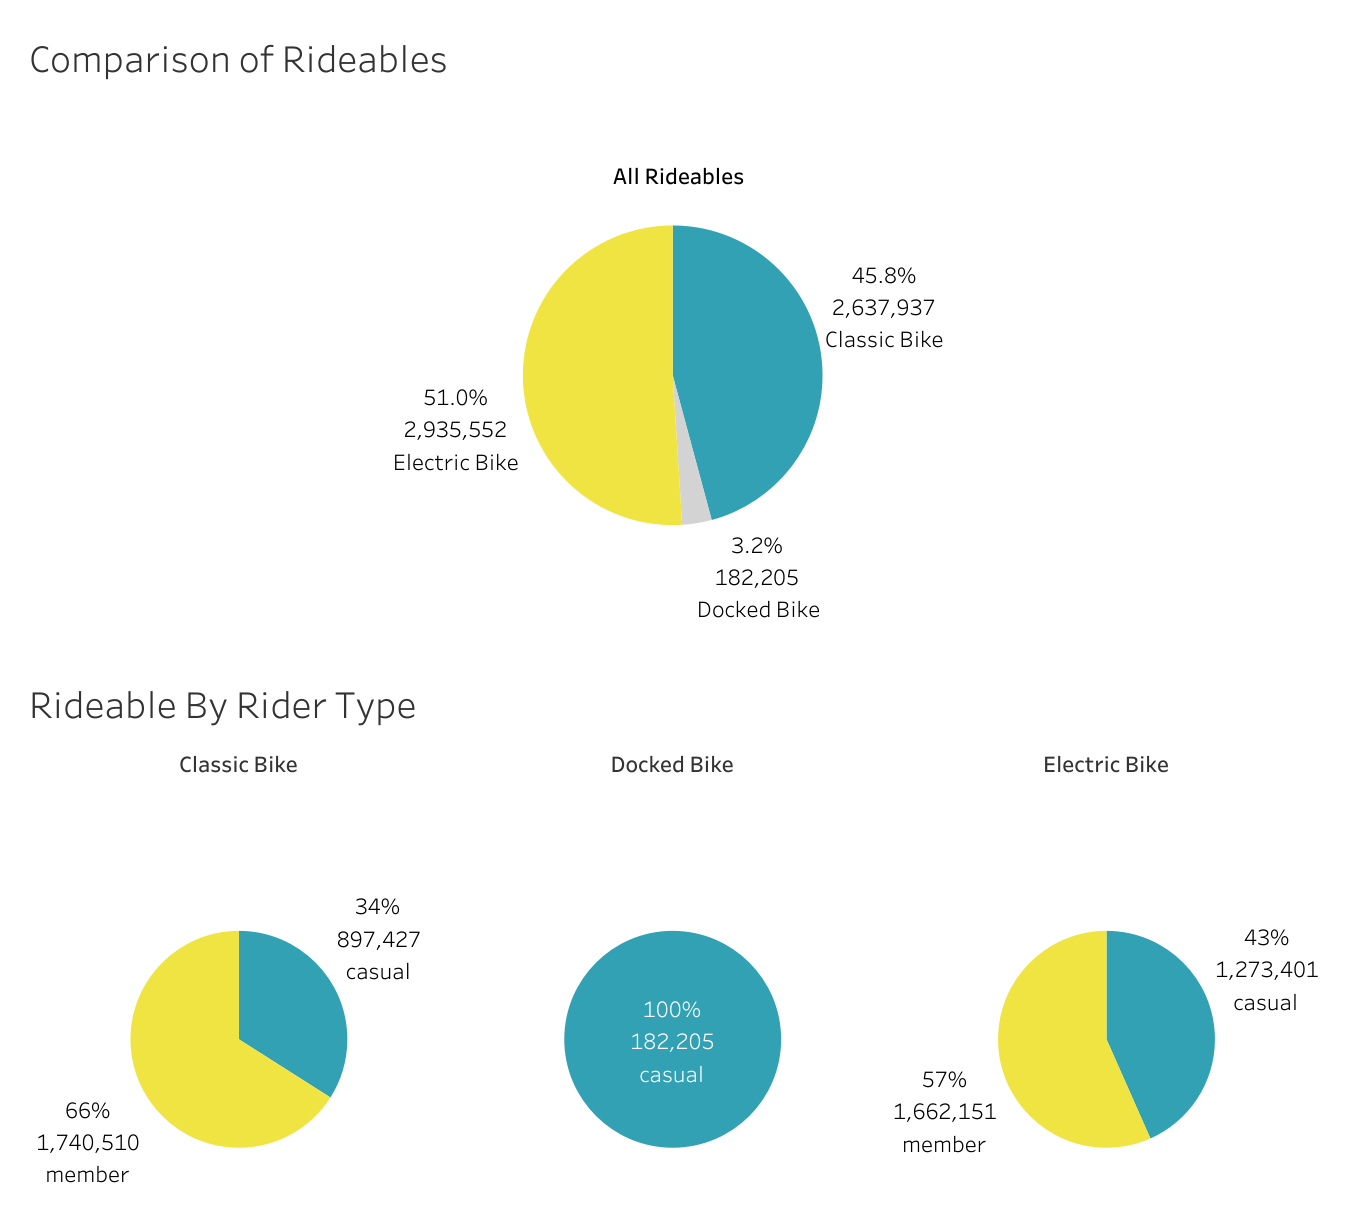
Who’s Riding What Bike?
Let’s keep things simple here for the next piece. Below is a comparison of the three ride types and how member & casual riders use them. More casual riders seem to prefer electric bikes, arguably for joyrides around the city without the strain of a classic pedal bike. However, classic bikes are slightly preferred by member riders, but it’s not a significant amount. Essentially, they’re tied. The Docked bikes only have a small usage by casual members. This could be due to a number of reasons: docked bikes aren’t included as a member benefit, there aren’t very many docked bikes in the city and are more of a novelty for casual riders, or the docked bikes may be seen as inferior. The docked bikes may even be the “disability” friendly style of bike and therefore only has a small subset of riders to begin with.
Are People Commuting or Joyriding?
To better understand when casual rider and member riders, I created heat maps of the weekdays to visualize the number of rides each hour of each day of the week.
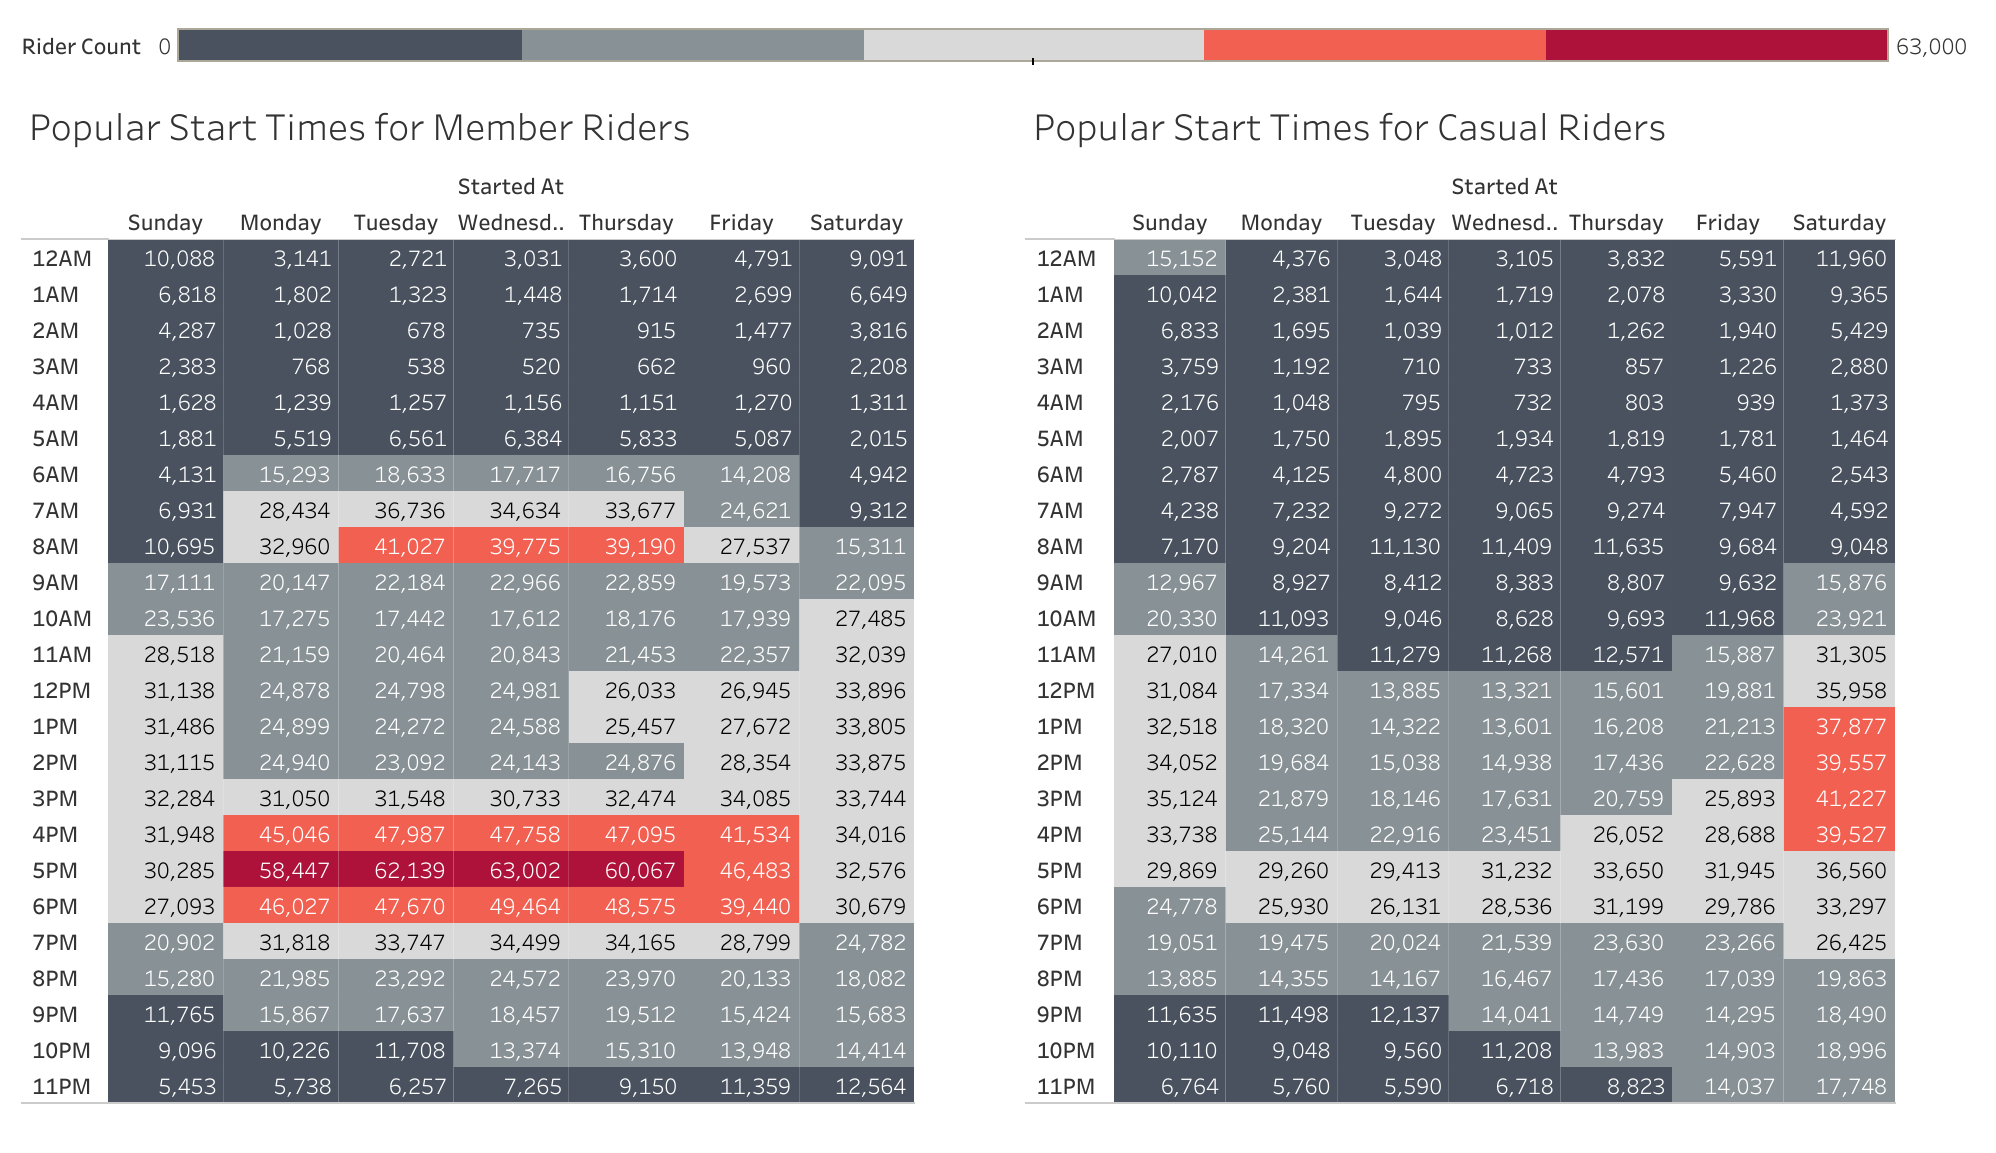
On the left, casual riders more frequently ride on Sundays and Saturdays, but are also using them in the late afternoon between 4PM and 6PM, indicating either a commute home or after work joy ride. On the right, members are also most frequently riding in the late afternoon between 4PM and 6PM, presumably for a commute home. However, they have a higher number riding in the mornings around 8AM, suggesting a commute going to work. These results are fairly predictable as someone wanting to use a bike share for a commute to and from work would benefit from a membership to a bike-share company.
How Long Can Someone Borrow A Bike?
To me, the trip duration became the most intriguing bit of data. I first started with the monthly average (below chart on the left) and thought the average trip durations seemed incredibly high, especially in the Winter Months. As a sanity check, I pulled the monthly median trip durations (below chart on the right) and found it to be closer to what I was expecting.
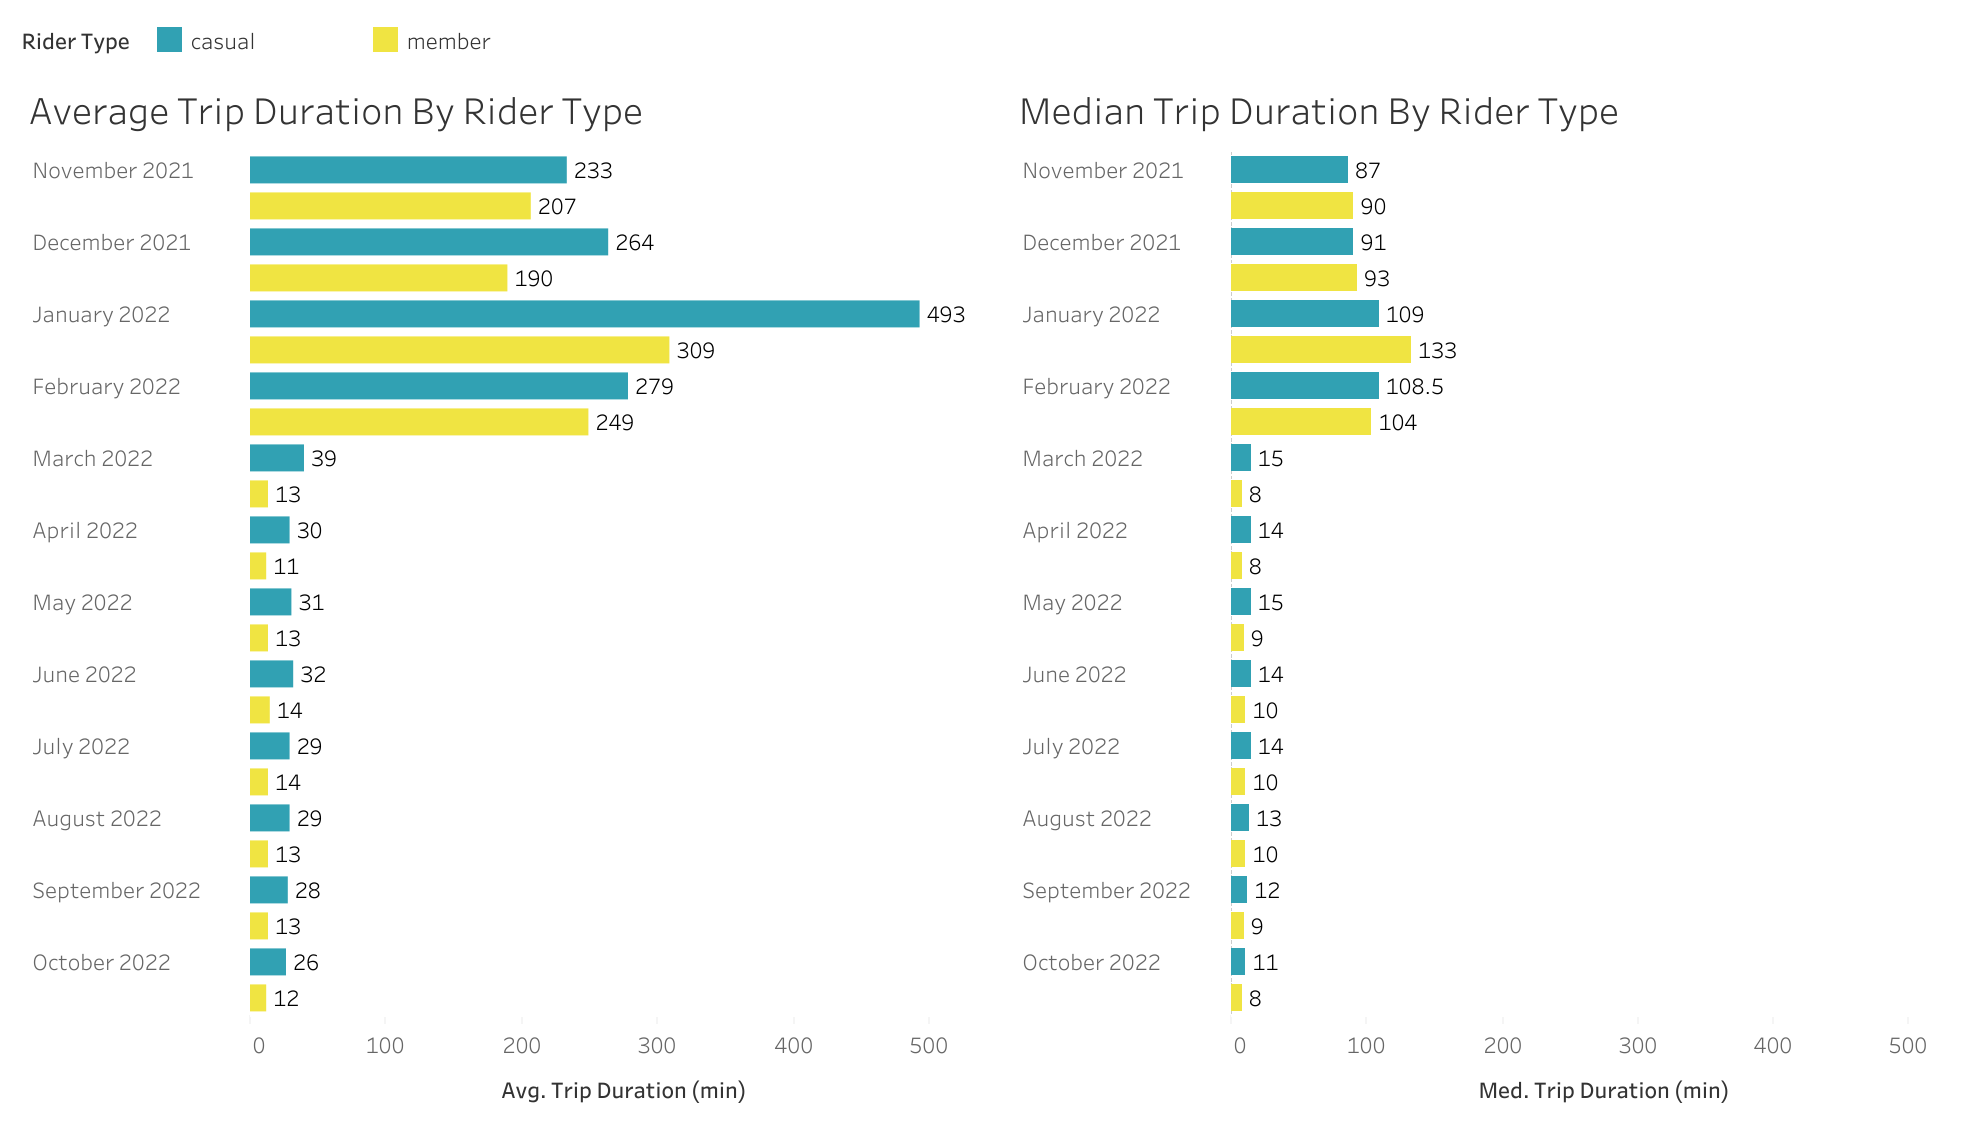
The winter months still have very high average and median trip durations. But why are average and median trip durations so different?
How Long Are These Rides Anyway?
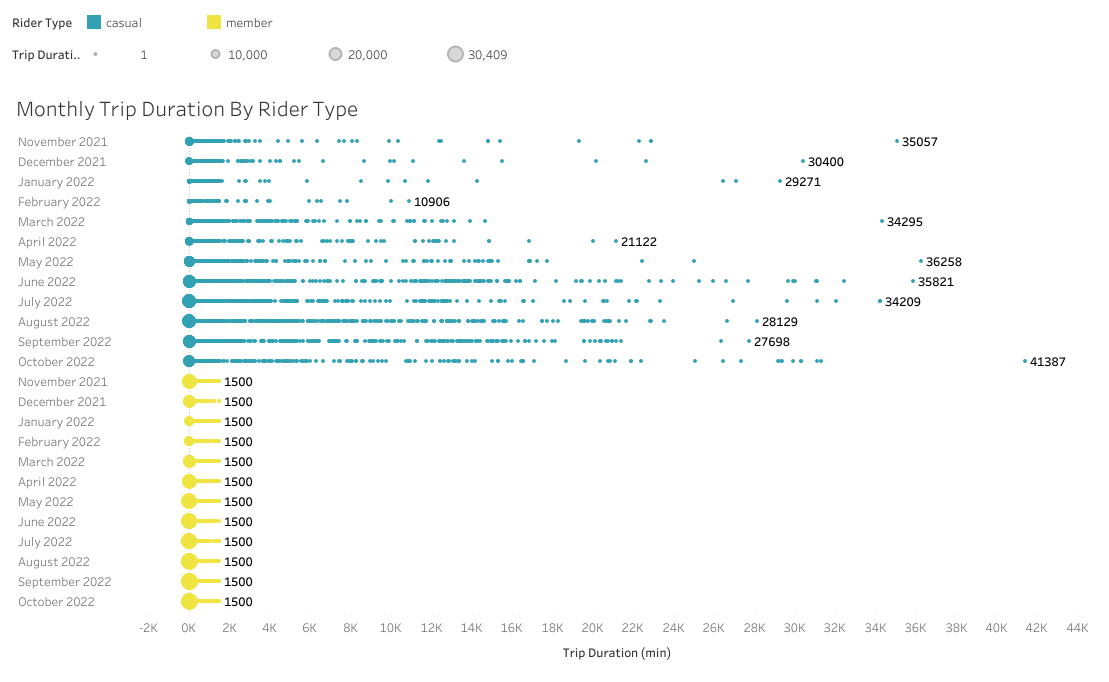
The plot above shows what’s happening to the average and median. The bigger the dot, the more rides had that trip duration. As the trip duration increases, the number of repeat trip durations drops to onesie-twosies after the first hundred or so minutes. Each month has its max trip duration labeled on the right side of the data. What’s happening to the average and median is that they’re pulled by the all of these inexplicably long trip durations. Since the winter months have fewer overall rides, they are more heavily influenced by the long trip durations. Statistically, they are outliers and likely indicate that someone neglected to “end” their ride.
All of the member riders have a monthly max trip duration of 1500 minutes, which corresponds to 25 hours. Without confirming with Cyclistic, I am guessing that a membership perk or limitation (depending on how they’re billed) is a ride limit of 25 hours in duration.
Casual riders appear to have no cap with the longest being October 2022 with a trip duration of 41,387 minutes, about 690 hours, or about 28.75 days! If they’re charged by the minute, that’s a hefty bill reminiscent of the early cell phone days when you didn’t get unlimited minutes. Even if billing is a flat rate to start the ride, this is not a good situation to have a bike locked into an excessively long ride.
How Many Rides Are Over/Under 60 Min?
So let’s zoom in on those big dots and see just how many rides a month are 60 minutes or less and how many exceed that.
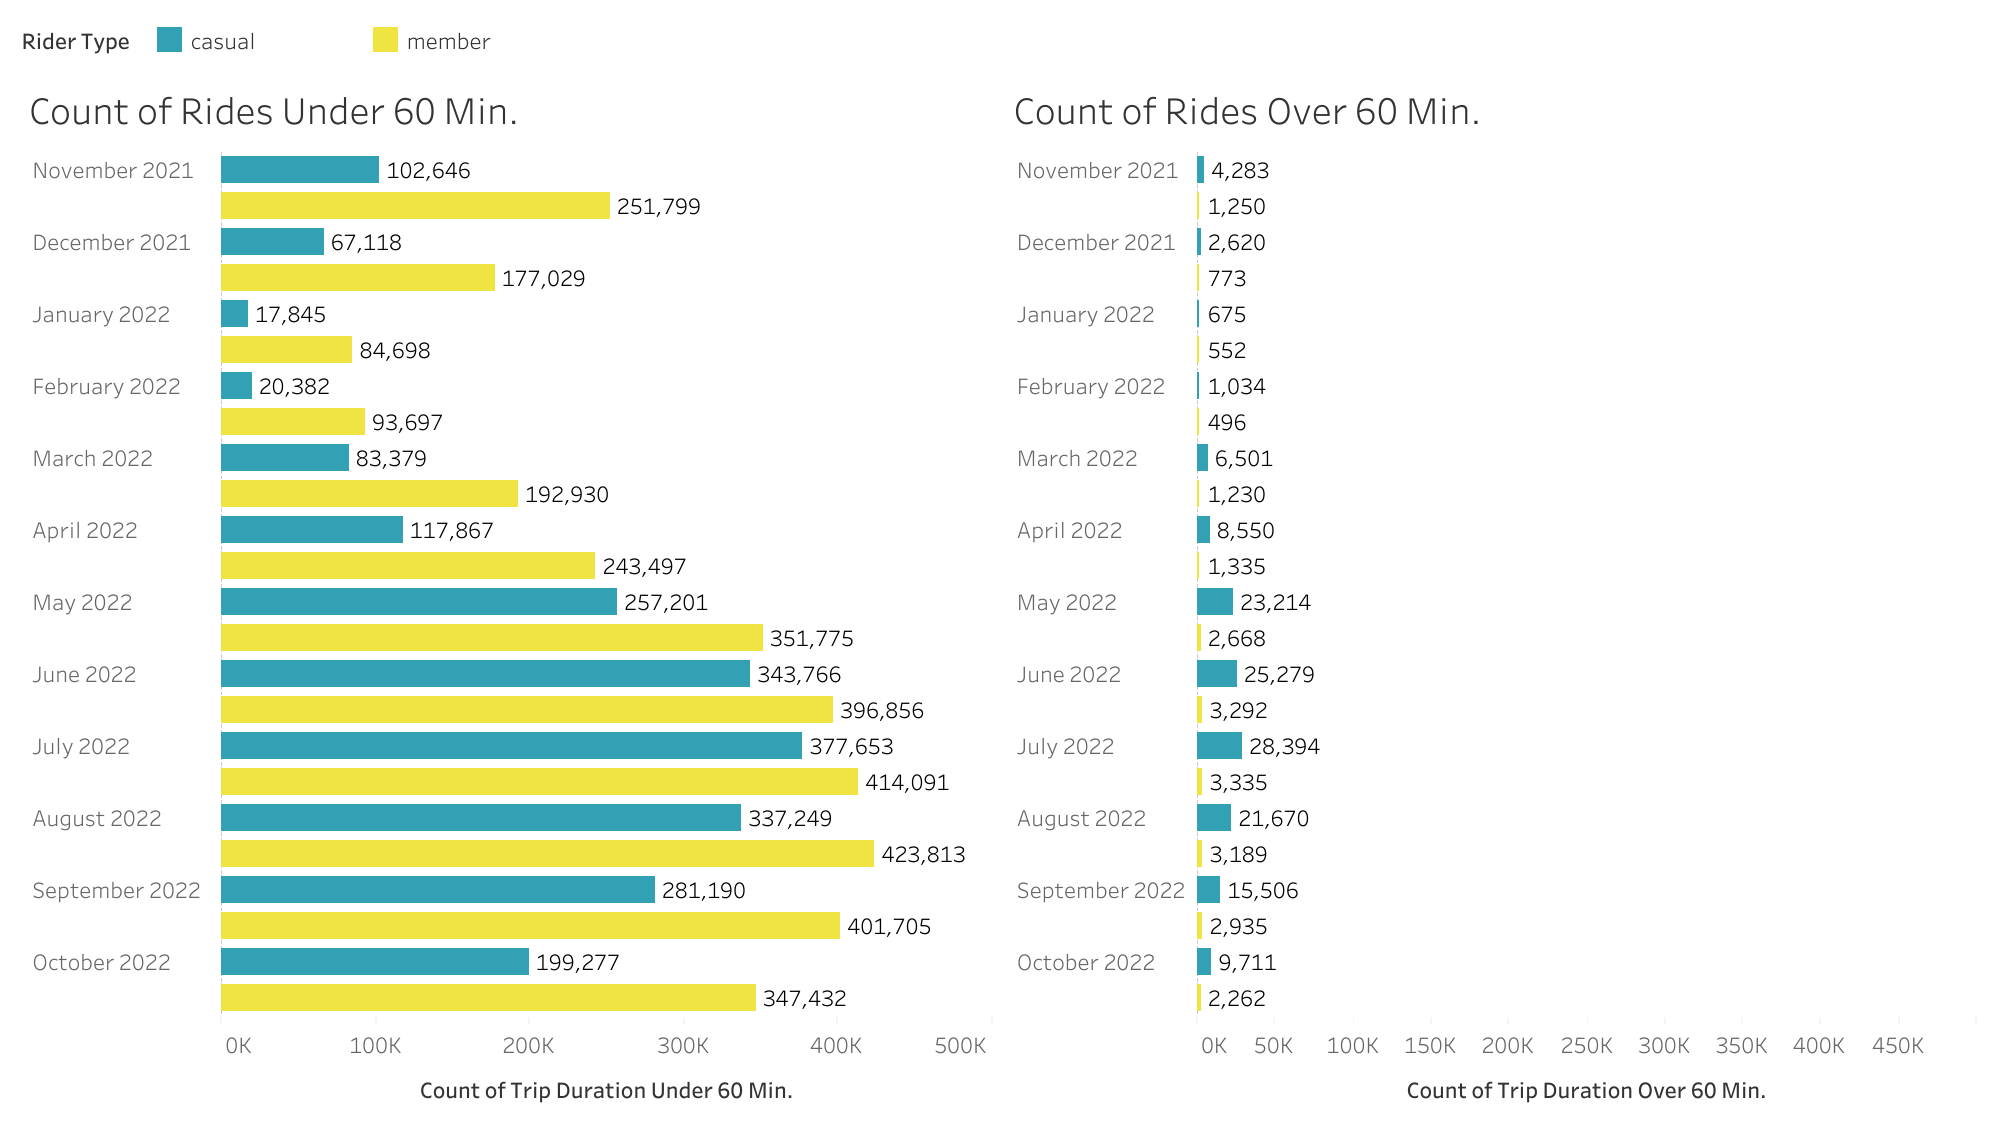
Clearly only a small subset exceed 60 minutes and most of them are casual riders. This of course makes sense as very few members using bikes for commuting are going to need the bike for more than an hour. Joyriders and aspiring cyclists would be more apt to exceed an hour for fun or a city tour perhaps.
It would be interesting to check customer information to see how many casual riders fit into more of a tourist category. One way of checking this would be to check zip codes on the billing credit card. Something to think about.
Where Are People Starting and Stopping Their Ride?
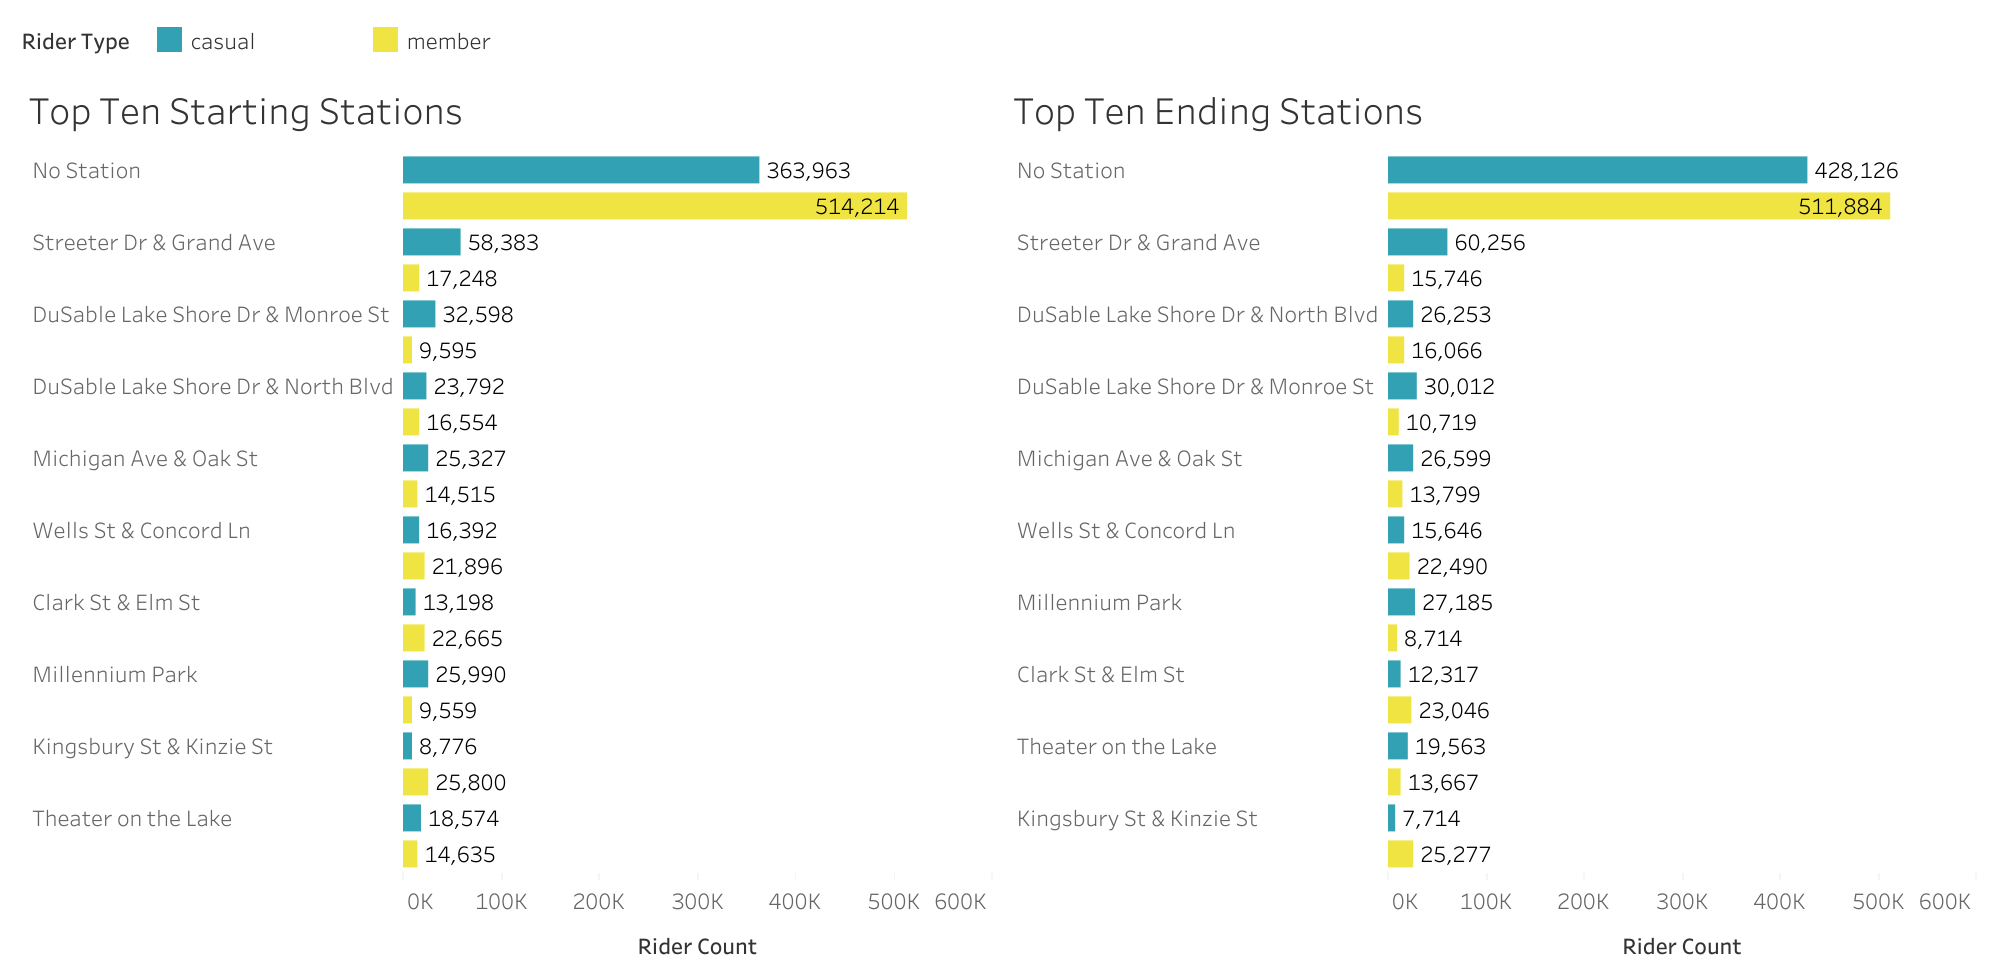
Lastly, just out of curiosity, the vast majority of riders just pick up a bike off the street and get going. That’s clearly the most convenient option for most. The most popular station for casual riders is the Streeter Dr & Grand Ave station, while member’s seem to like Kingsbury St & Kinzie St for their start and stop. This is informative to see which stations are frequented the most, but more important to ensure thats bikes are everywhere around the city for anyone to start a ride.
In a follow-up analysis, it would be informative to see popular routes looking at popular start/stop combinations or even to just check the most common latitudes and longitudes. Then Cyclistic can make efforts to make efforts to relocate bike from less popular sites to more common areas of the city.
So what now?
My actionable recommendations based on this analysis:
- If annual memberships are the only offering, consider offering a 6 month membership, or even a summer membership, to encourage fair-weather riders to join as members.
- Determine the most popular locations for members to start their rides, especially in the afternoon, and find ways to get bikes there. Kingsbury St & Kinzie St station would be a good place to start.
- Put a cap on casual rides to limit the trip duration length and consider premium pricing if a casual rider takes the bike for over a certain amount of time. With this, Cyclistic should start tracking trip duration rather than just start and end time for trips to avoid issues around daylight savings times.